
A mobile Lighthouse for React Native
One command, both platforms, a score you can act on.

Web developers have Lighthouse. Run a command, get a score, know exactly where your app falls short. It changed how teams think about performance. Ship a page that scores below 90? The PR comment catches it before your users do.
React Native developers don’t have that yet. You get “the app feels slow” in a Slack thread. Then someone opens Xcode Instruments, scrolls through flame graphs for twenty minutes, tries to decipher memory addresses, and comes back with... not much.
I wanted that same Lighthouse experience for mobile.
\
Mobile profiling today takes real commitment
Performance matters more than most teams realize. According to Callstack’s research, 70% of users will leave an app that responds too slowly — and even a 0.1-second improvement can lift conversion rates by over 10% (these are general mobile/web stats Callstack cites, not RN-specific, but the principle holds). The numbers are clear. The question is: how do you actually measure it?
Right now, profiling a React Native app means reaching for native tooling. On Android, you open Android Studio, attach the profiler, record a session, then interpret the output. On iOS, you launch Xcode, pick an Instruments template (there are dozens), record, and hope you chose the right one. Callstack wrote an excellent walkthrough of this process — Time Profiler, Flipper, Perfetto, the whole chain. It’s thorough and well worth reading. It also makes clear just how many steps are involved.
That workflow works fine if you live in these tools daily. But a large portion of React Native and Expo developers come from web backgrounds. They’ve never spent serious time in Xcode or Android Studio beyond the initial project setup. The learning curve is steep when all you want is “how’s my app doing?”
Then there’s the cross-platform piece. Even if you master both toolchains, you still can’t compare iOS and Android performance side by side. Different metrics, different formats, different tools. Hard to get a unified picture.
Flashlight showed that CLI-based profiling resonates with RN developers — a really smart project. It covers Android well. iOS support has been on the roadmap since 2023, though it hasn’t landed yet. That’s a tough gap when your team ships on both platforms.
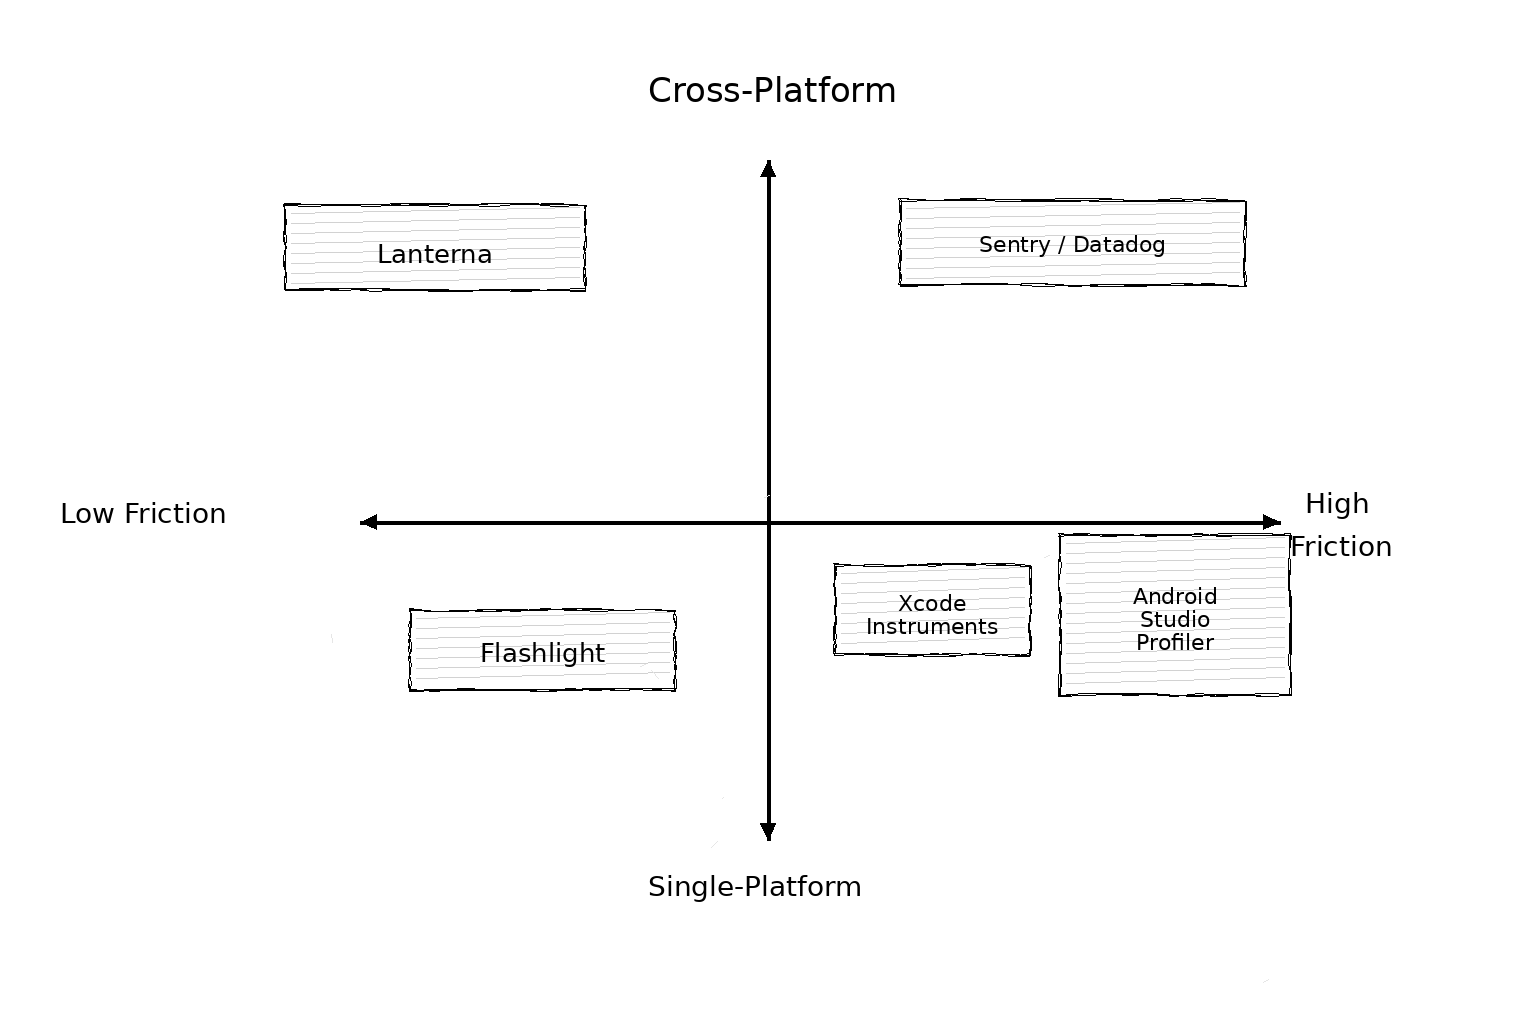
Here’s how the landscape looks right now:
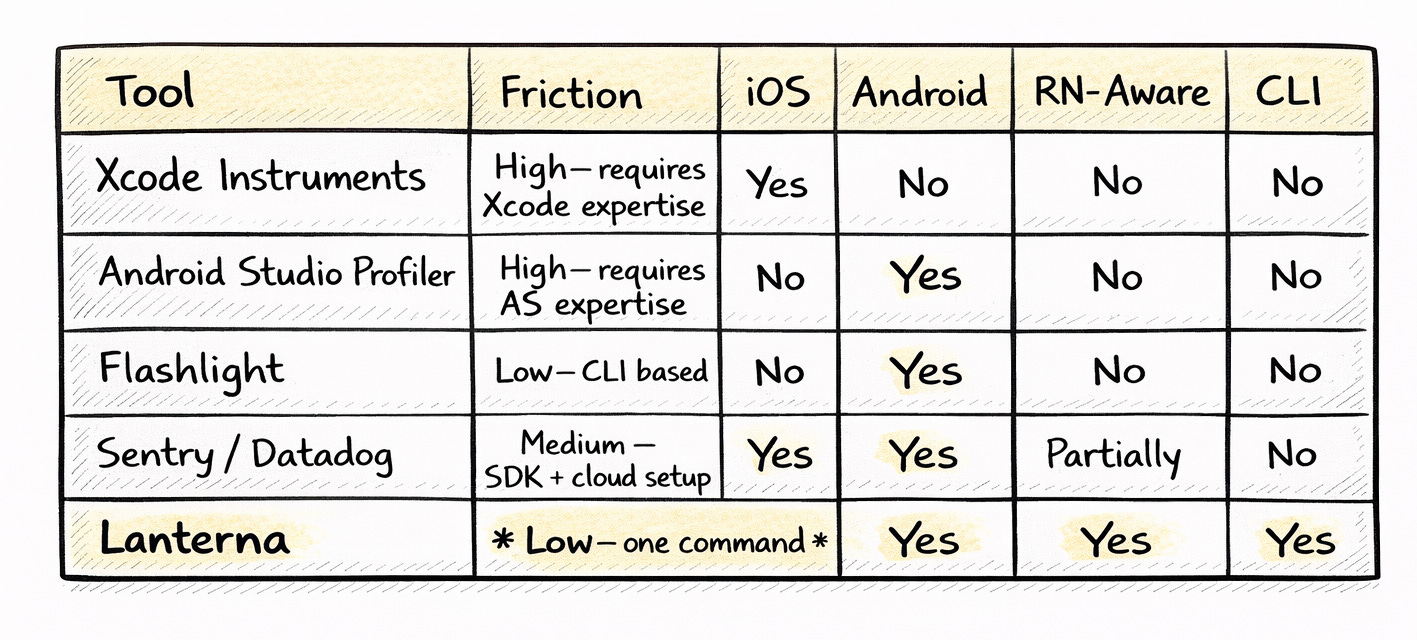
Every tool in that table does something well. Xcode Instruments is incredibly powerful. Android Studio’s profiler gives you memory allocations down to the object level. Sentry tracks production performance at scale. Lanterna doesn’t replace any of them. It fills a different niche: the quick, cross-platform, RN-specific read that you run from your terminal before reaching for the heavy tools.
Native profiling, sans Xcode
Here is the technical reality: You don’t actually need to open Xcode to profile an iOS app.
Every Mac ships with xctrace, a command-line tool that can record a Time Profiler session, export the data, and shut down—all while Xcode stays closed. It looks like this:
xcrun xctrace record --template 'Time Profiler' --device <uuid> --attach <pid> --time-limit 10s
xcrun xctrace export --input recording.trace --xpath '...'
It’s powerful, fast, and painfully under-documented. This single command is what makes Lanterna possible. By combining xctrace on iOS with perfetto on Android, Lanterna normalizes the chaotic world of native tracing into a single, clean score.
Apple barely documents it. Search for xcrun xctrace, and you’ll find a handful of blog posts and some sparse man pages. But this command unlocks something powerful: iOS performance profiling without ever opening Xcode.
That’s the technical foundation of Lanterna. Once I realized you could capture and export iOS traces programmatically, the rest clicked into place. Combine xctrace on iOS with adb and perfetto on Android, normalize the data into a common format, score it, and suddenly you have Lighthouse for mobile.
lanterna measure com.example.appOne command. Both platforms. A score you can actually act on.
How the scoring works
Performance is subjective until you put a number on it. Lanterna gives every measurement a weighted 0-100 score, inspired by how Lighthouse grades web pages. But the weights are tuned specifically for React Native — because what matters on mobile isn’t the same as what matters on the web.
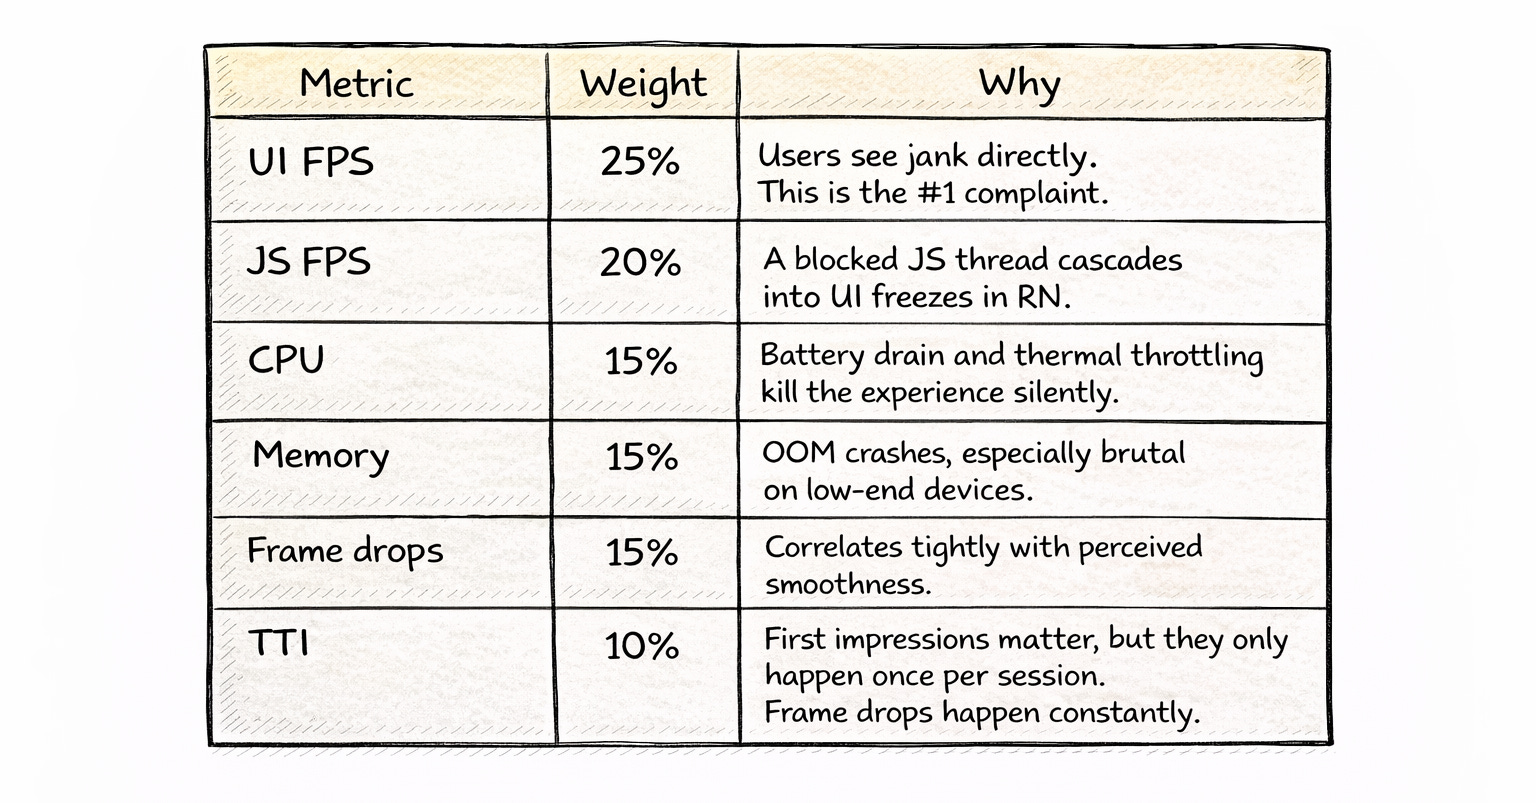
The scoring uses linear interpolation between thresholds — not just “good/bad” buckets. A score of 72 tells you something different than a 48. You can track trends over time, catch regressions early, and set team-wide baselines.
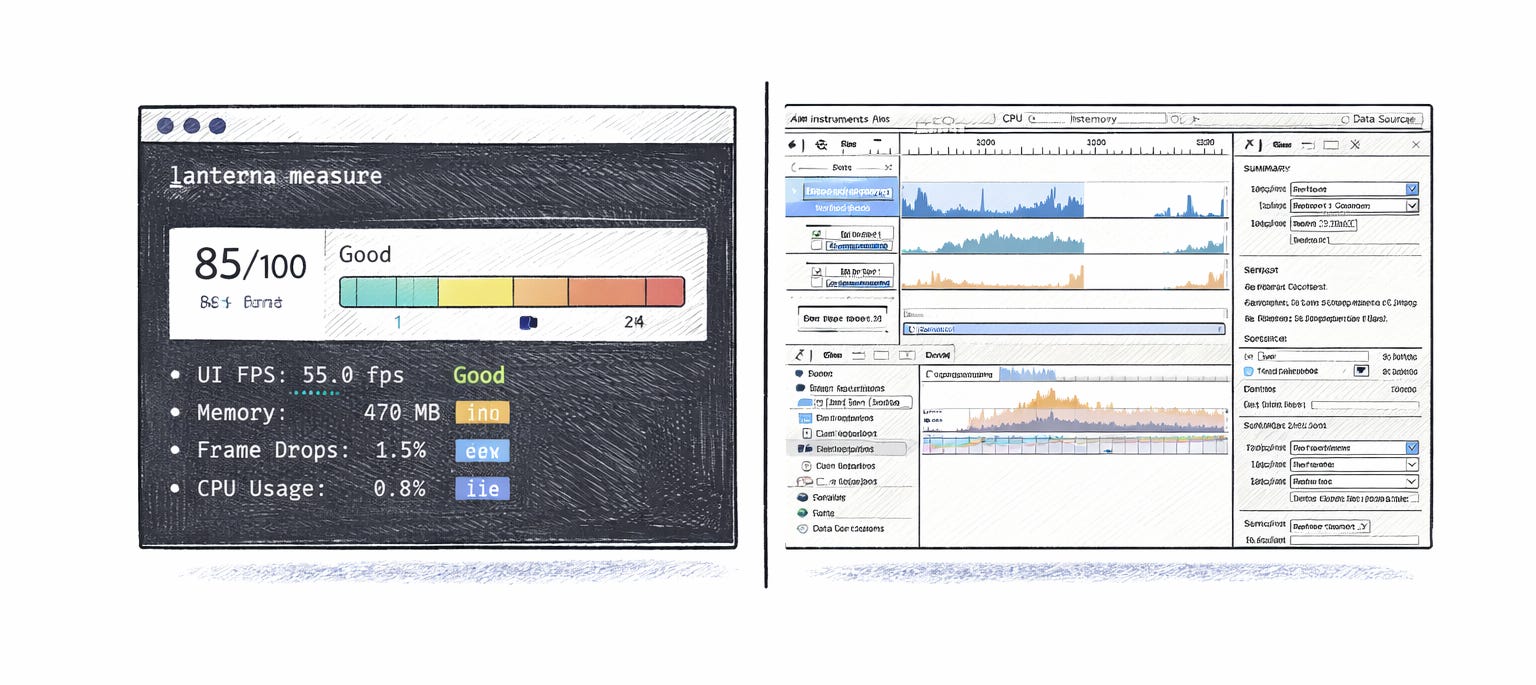
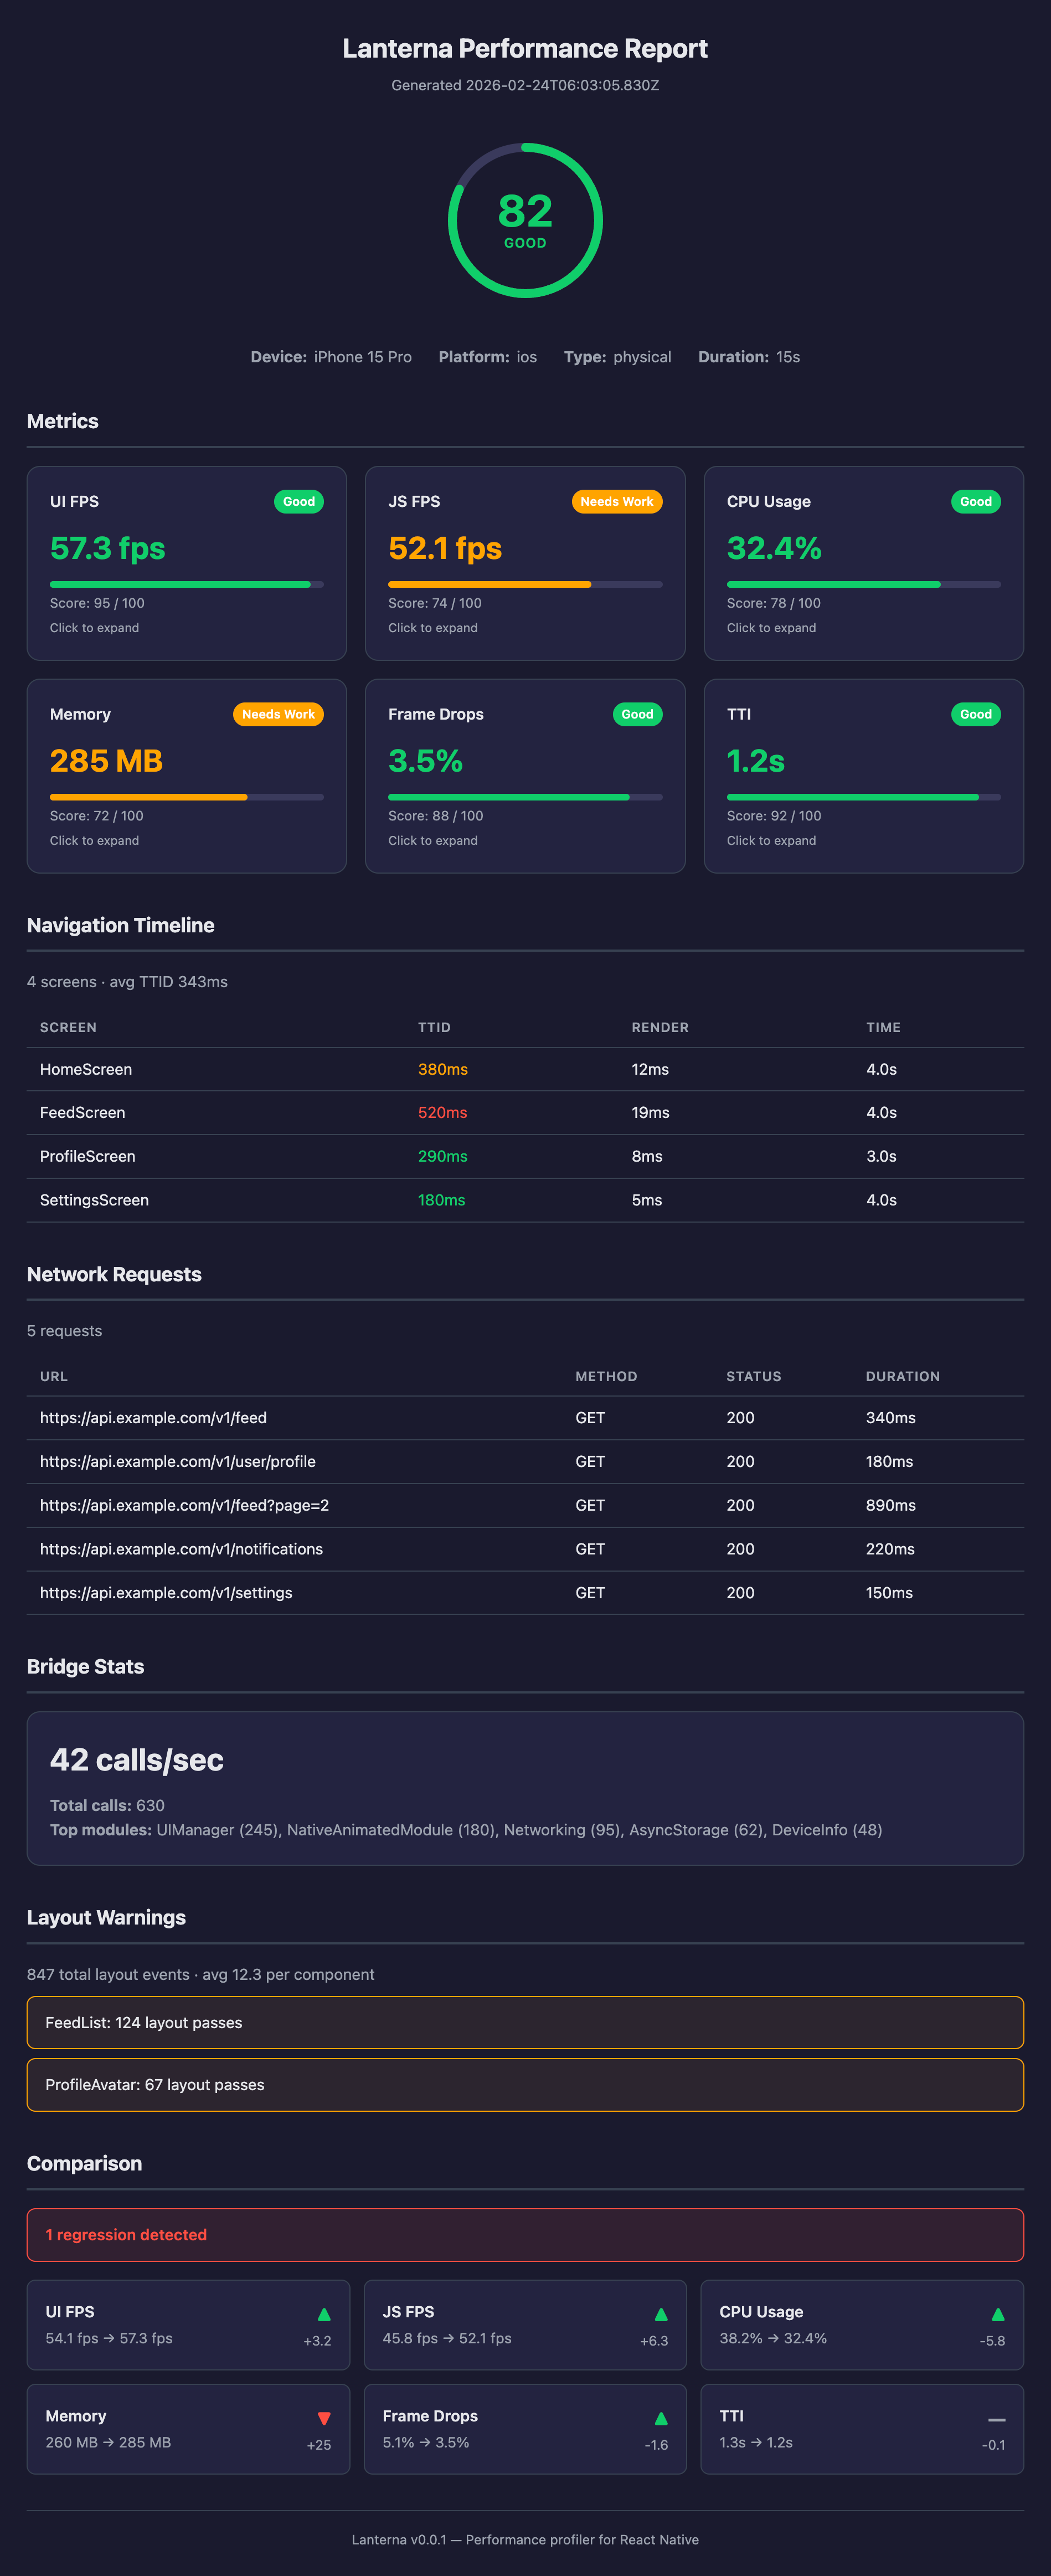
Here’s what real output looks like from a demo app session:
Score: 85/100 Good
████████████████████  85%

Device: iPhone 17 (ios, simulator)
Duration: 30s

UI FPS         57.5 fps    ████ 100
CPU Usage      0.0%        ████ 100
Memory         440 MB      █░░░ 30     ← flagged
Frame Drops    1.5%        ████ 100

Recommendations:
  [!!] Elevated memory consumption
Everything green except memory. That 440MB jumped out immediately — and the heuristic engine flagged it without me having to dig through any trace files.
Not just numbers — RN-specific recommendations
Most profilers tell you “CPU is high” and leave the rest to you.
Lanterna knows it’s looking at a React Native app. It ships with 11 built-in heuristics that reference actual RN APIs and patterns:
“FlatList re-renders detected — consider
getItemLayoutandwindowSizetuning”“JS thread blocked during navigation — consider
InteractionManager““3 synchronous bridge calls during render — consider batching”
“Screen TTID > 500ms — consider
React.lazyand code splitting”“120 bridge calls/sec — consider JSI/TurboModules”
These aren’t generic suggestions you’d find in a docs page. They fire based on your actual measurement data and point you to specific fixes. The difference between “memory is high” and “your ProfileScreen fetches 3 endpoints sequentially during mount, causing a 3.7s waterfall” is the difference between a tool and a teammate.
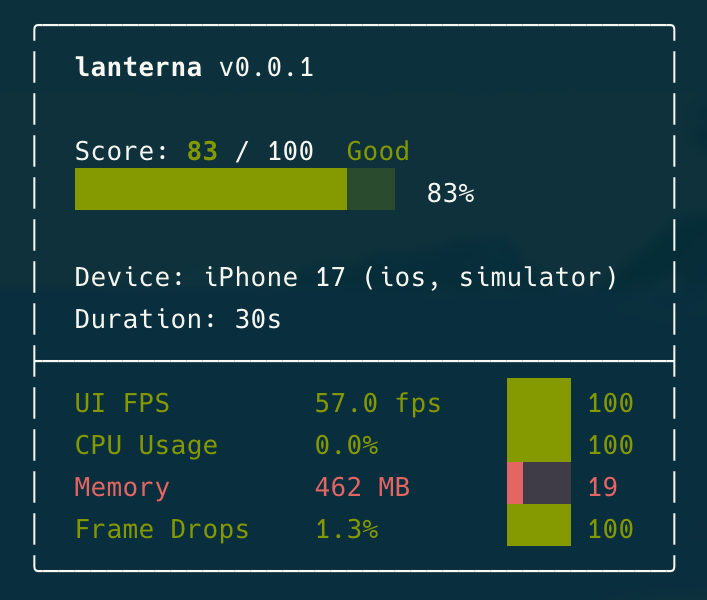
Recommendations:
[!!] Elevated memory consumption
Memory usage averaged 462 MB (score: 19/100). High memory increases the
risk of OOM kills, especially on lower-end devices.
Fix: Enable removeClippedSubviews on FlatList/SectionList to unmount
off-screen items.
Use a caching image library like react-native-fast-image with memory limits.
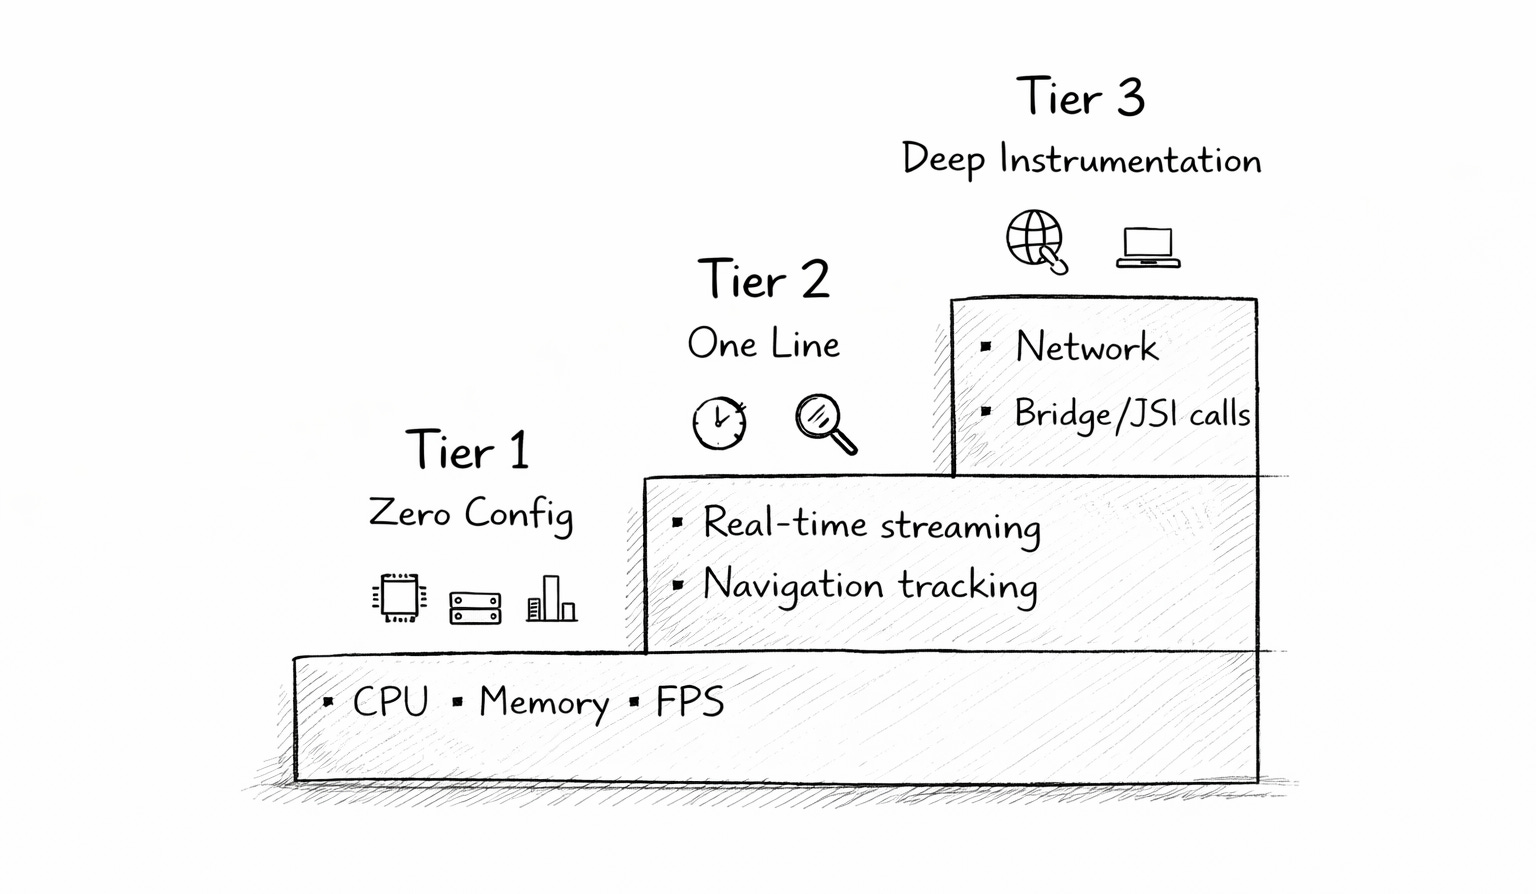
Check for retained closures and event listeners not cleaned up in useEffect return.Three tiers — start with zero config, go deeper when you need to
Most teams don’t need deep instrumentation on day one. They need a quick read on whether things are okay. Lanterna meets you where you are with a tiered approach:
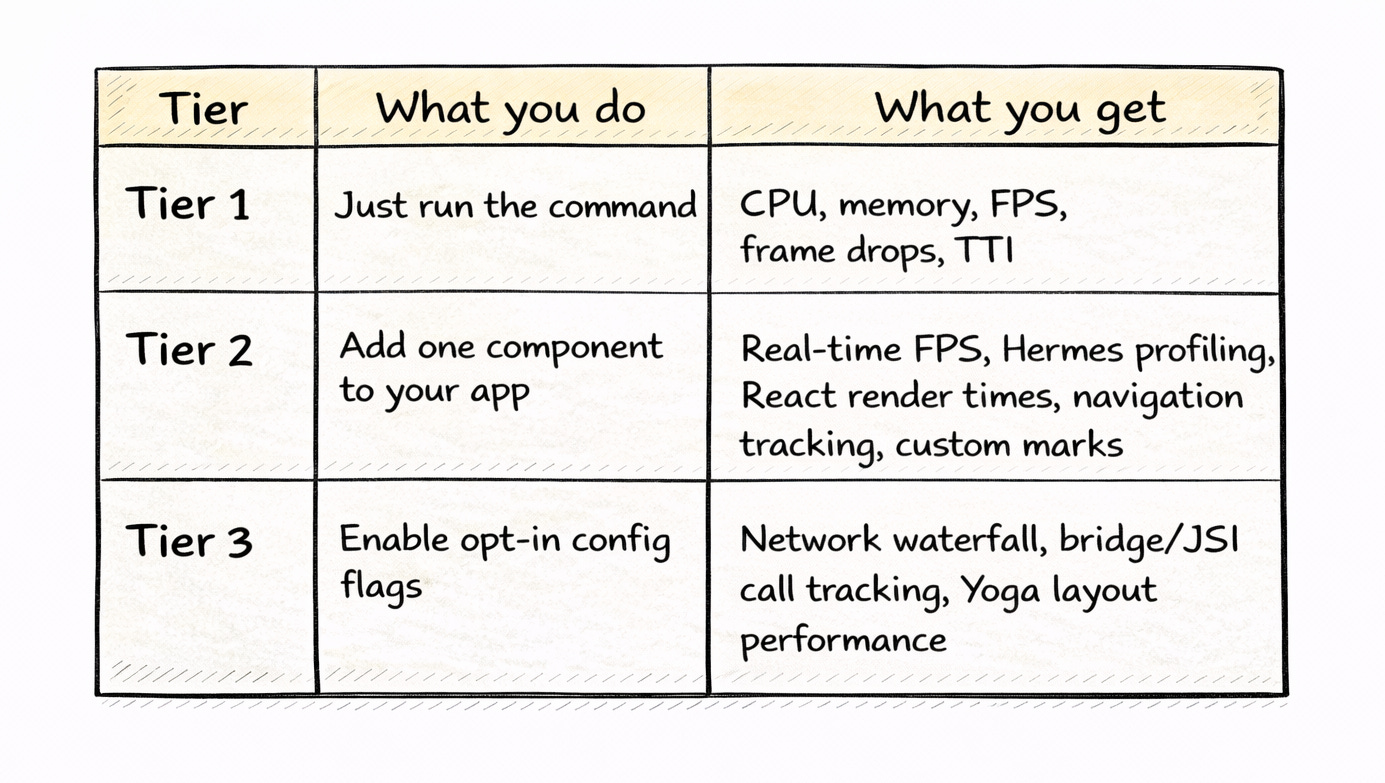
Tier 1 is the entry point. Run lanterna measure and it uses platform CLIs under the hood — adb shell top, dumpsys meminfo, xcrun xctrace — to collect metrics externally. You don’t install anything in your app. You don’t change a single line of code. Works on production builds too.
Tier 2 unlocks the real-time picture. Add the @lanternajs/react-native package and wrap your app:
<LanternaProvider navigationRef={navigationRef}>
  <Stack />
</LanternaProvider>
That’s it. CADisplayLink feeds FPS data, the Hermes profiler captures JS thread activity, and the React Profiler API tracks component render times. Everything streams over WebSocket to the CLI at 500ms intervals.
Before this single component existed, wiring up in-app performance monitoring meant writing around 160 lines of boilerplate — polling intervals, snapshot listeners, nine different modules. Now it’s one wrapper.
Tier 3 is for the deep dives. When you need to understand exactly why a screen is slow, opt-in flags unlock network waterfall tracking, bridge/JSI call frequency, and Yoga layout recalculation timing. Most teams won’t need Tier 3 daily. But when you do, it’s there.
Navigation performance
Ask any React Native performance discussion what people want most. Per-screen breakdowns. Always. “Which screen is slow?” is the first question every team asks, and no open-source tool answered it — until now.
Lanterna tracks every navigation event and gives you:
TTID (Time to Initial Display) per screen
Render duration per screen
Time on screen
Slowest screen identification
It works with React Navigation and Expo Router out of the box. The demo app has five screens with intentionally different performance profiles:
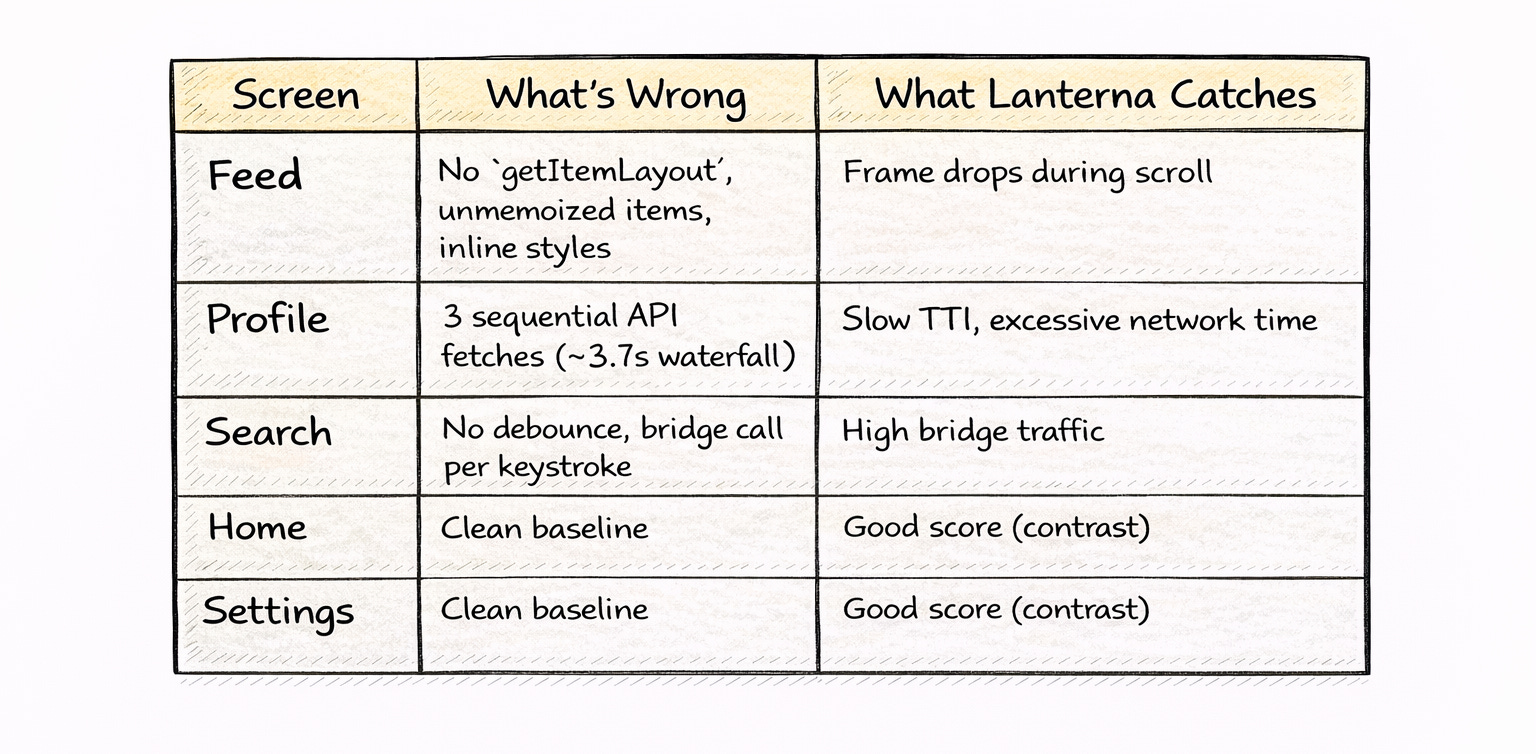
When your PM asks, “Why does the profile screen feel slow?”, you can point to a number instead of a hunch.
Live monitoring
Sometimes you don’t want a report. You want to see what’s happening right now, while you interact with the app.
lanterna monitorThis opens a live dashboard that streams metrics over WebSocket:
lanterna-app / ios
UI FPS: 60.0  Drops: 0
Memory: 530 MB
Real-time updates at 500ms intervals. Tap around your app and watch the numbers move. Scroll a FlatList and see frame drops spike. Navigate to that heavy screen and watch memory climb. It turns performance from an abstract concept into something tangible.
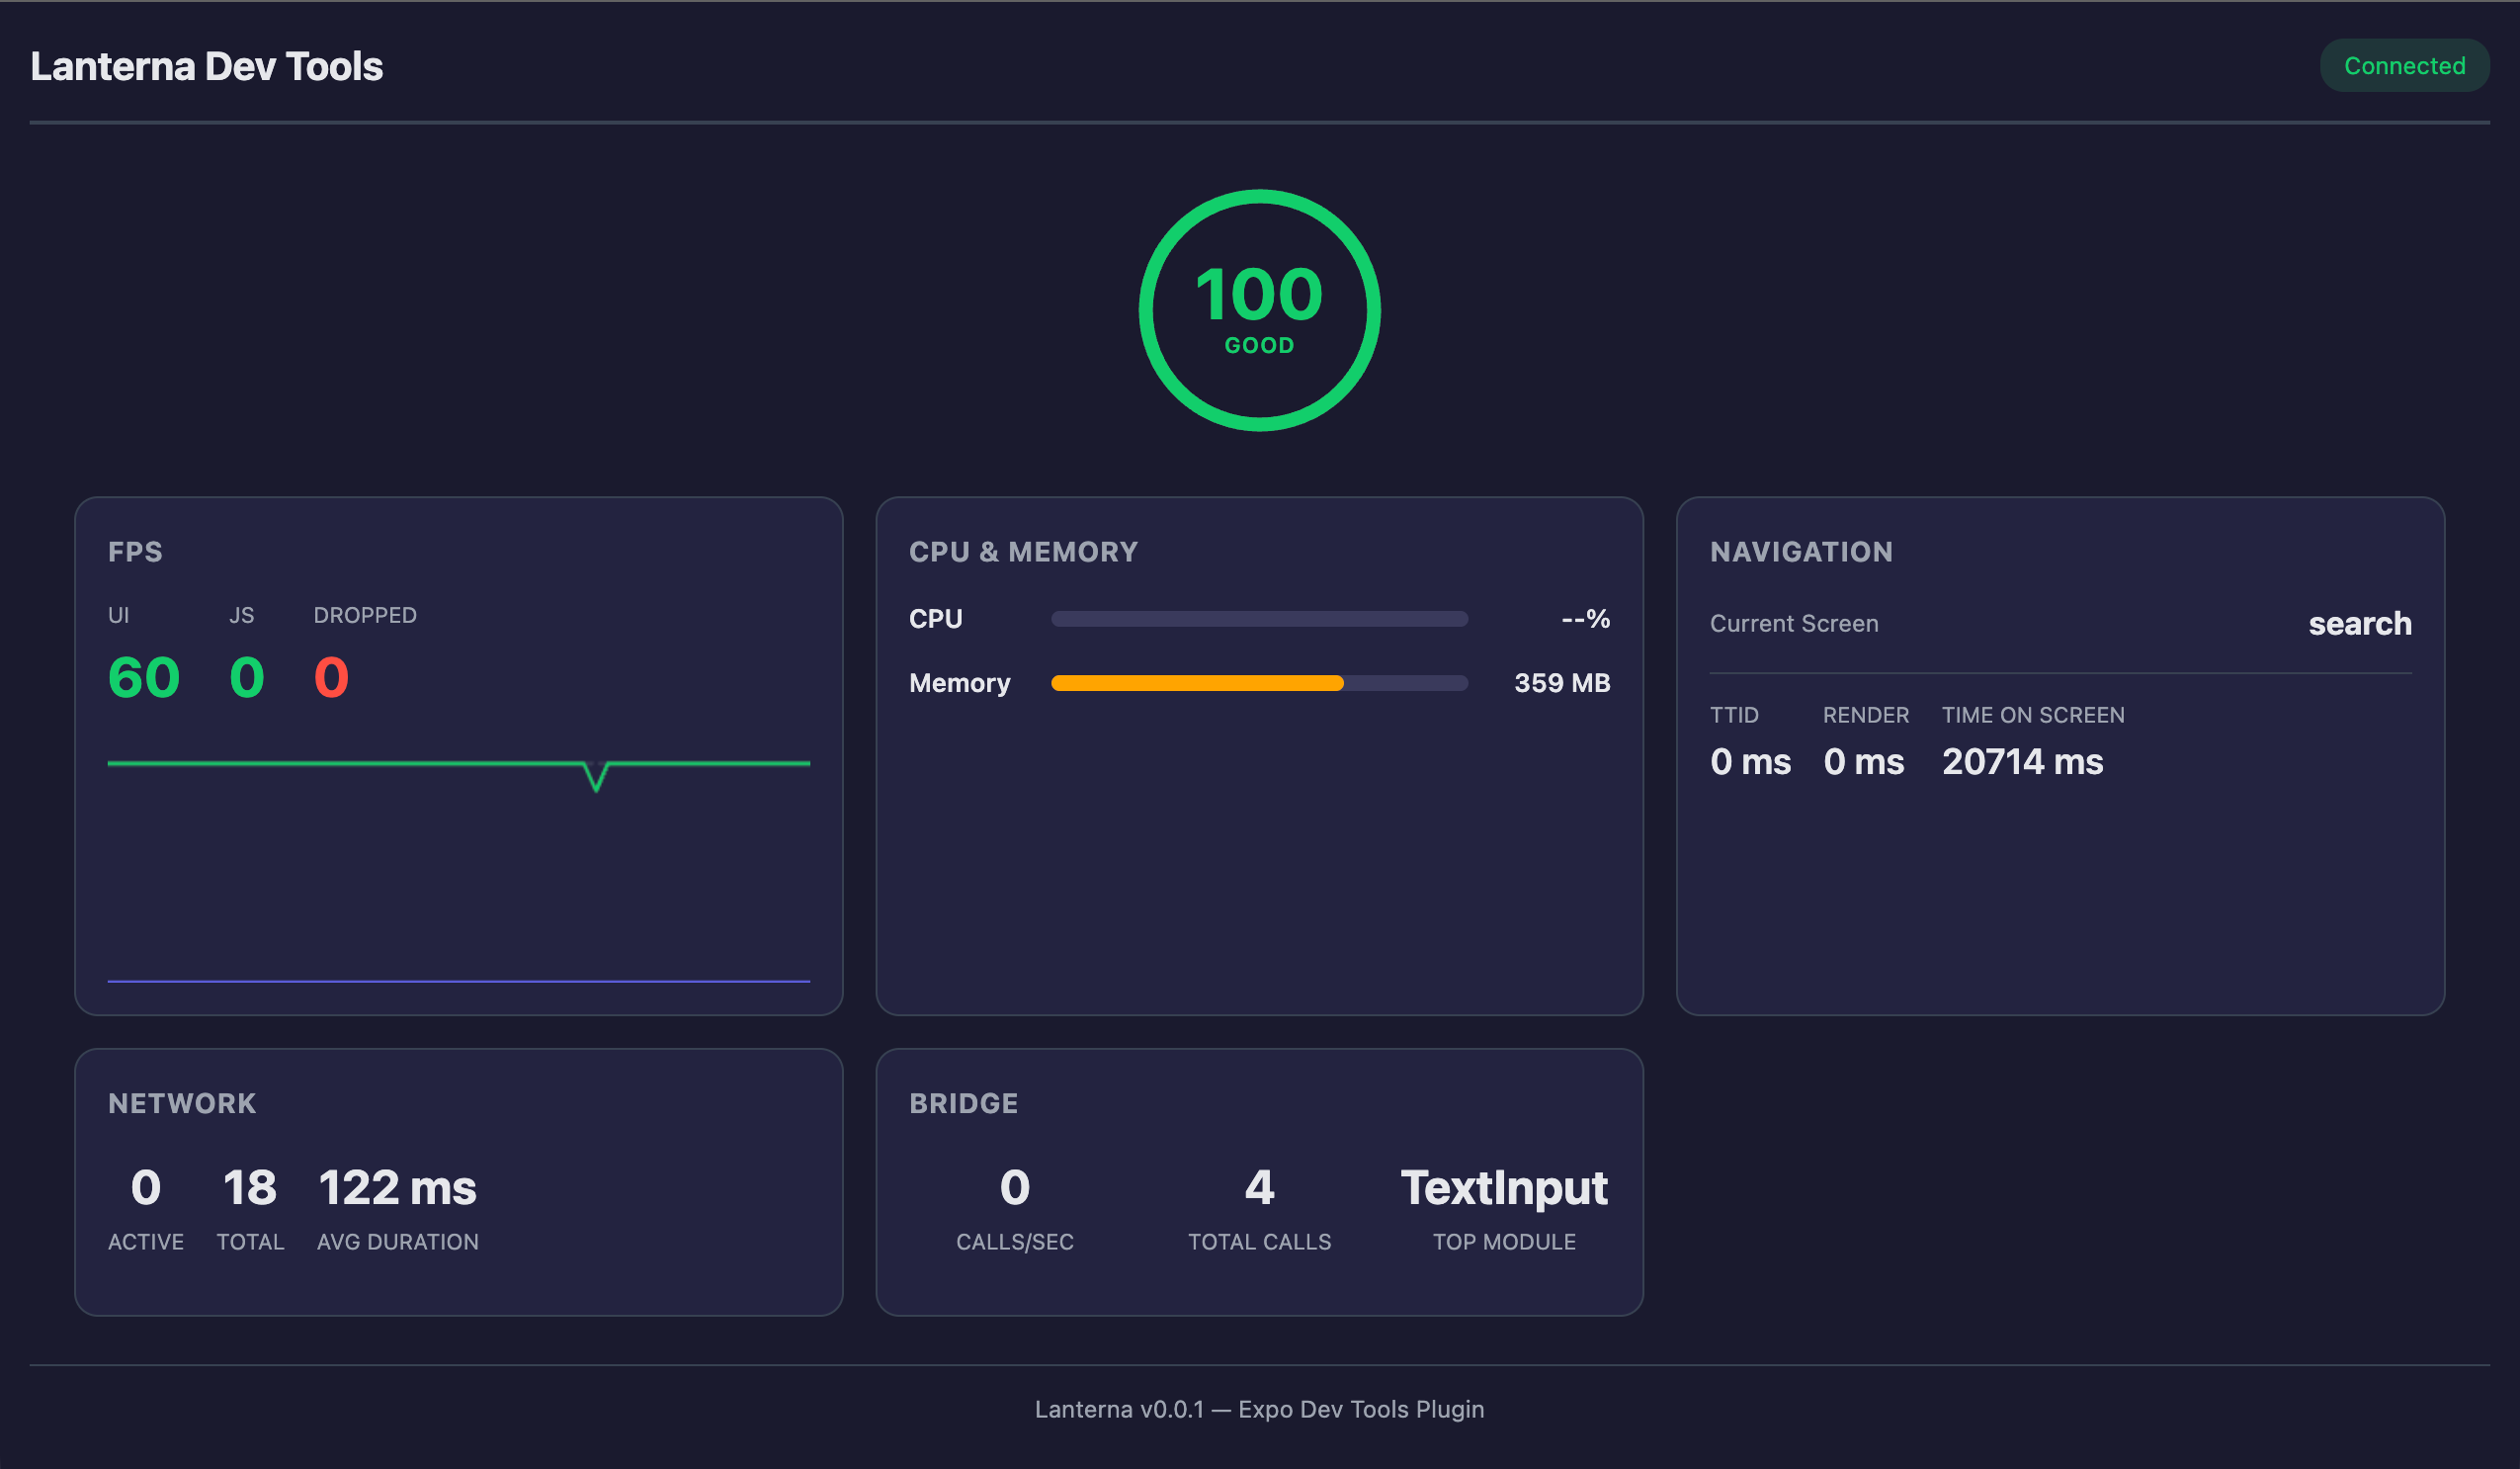
For Expo projects, there’s also a DevTools Plugin. Hit Shift+M in your terminal, open the browser dashboard, and get a full live view: score gauge, FPS graph, memory, navigation tracking, network requests, and bridge calls. All panels are populated with live data.
Performance as a CI check, not a fire drill
Here’s where Lanterna becomes a team tool, rather than a solo debugging aid.
# Output JSON for CI pipelines
lanterna measure --output report.json
# Compare against a baseline
lanterna measure --baseline previous.json
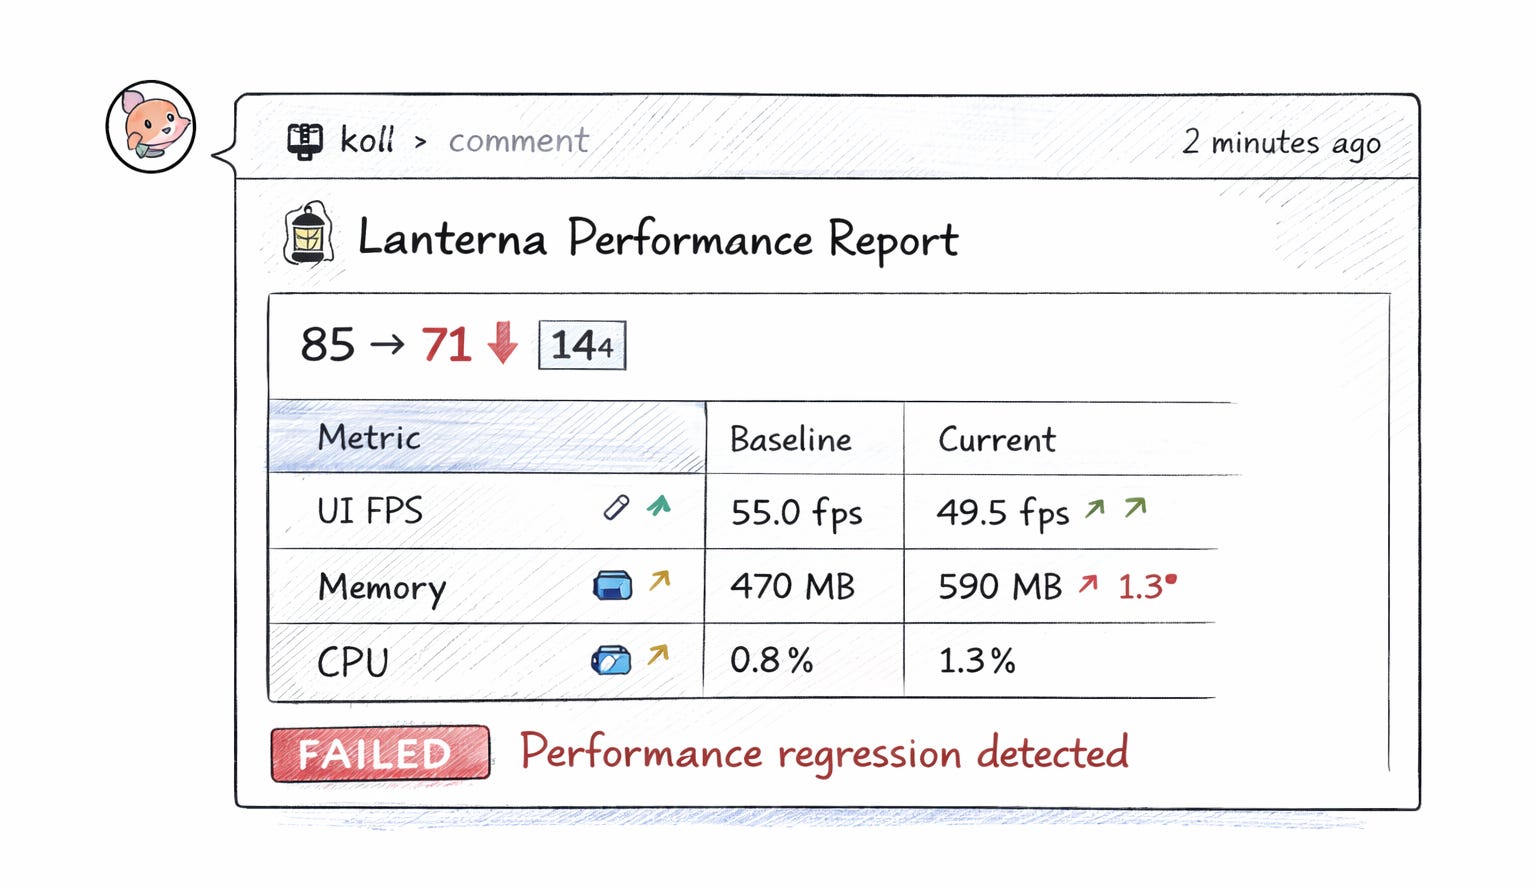
# Exit code 1 on poor score — blocks the mergeWire this into GitHub Actions and every PR gets an automated performance comment. Score dropped from 85 to 71? The diff shows exactly which metrics regressed. No more shipping performance regressions and finding out from user reviews three weeks later.
Pair it with Maestro for the full picture: run your E2E test flows while Lanterna measures in the background. The demo app ships with three Maestro flows — full navigation, feed scrolling, and profile loading — all of which pass and are instrumented.
Expo-first approach
The React Native ecosystem is consolidating around Expo. Lanterna leans into that:
Expo config plugin — the native module installs itself. No manual linking, no pod tweaking.
Expo Router integration — navigation instrumentation works automatically with file-based routing.
Expo DevTools Plugin — hit Shift+M and get a browser-based performance dashboard alongside your existing dev tools.
If you’re on Expo (and increasingly, you should be), Lanterna feels native to your workflow. Not bolted on.
What Lanterna isn’t (and doesn’t try to be)
I want to be upfront about this: Lanterna doesn’t replace native tooling. It complements it.
Xcode Instruments gives you object-level memory allocations, energy diagnostics, Metal GPU traces, and dozens of specialized templates built over fifteen years. Android Studio’s profiler offers heap dumps, thread-level analysis, and deep system trace integration. These are phenomenal tools. If you’re debugging a Core Animation bottleneck or tracking down a specific JNI leak, you absolutely want Instruments or Android Studio. Lanterna won’t go that deep.
Here’s how I think about it. Lanterna is your first pass — the quick health check that tells you where to look. Native tools are your deep dive — the surgical instruments you reach for once you know what’s wrong.
A few concrete limitations worth knowing:
iOS FPS without the in-app module:
xctracedoesn’t expose an external FPS metric. You need Tier 2 (the native module with CADisplayLink) for real-time frame rate on iOS. Tier 1 captures CPU, memory, and time profile data — but not FPS.Simulator vs real device: Some metrics behave differently. Energy profiling on a simulator doesn’t mean much. Memory numbers on simulators use the host machine’s resources. Lanterna flags when you’re on a simulator, but real device testing is always closer to the truth.
Debug vs release builds: React Native debug builds run significantly slower due to dev mode overhead, the Metro bundler, and LogBox. Lanterna reports what it measures — so profile release builds when you want numbers that reflect production.
Scoring is opinionated: The weighted model works well for most RN apps, but your app might have different priorities. A streaming video app cares more about frame drops than TTI. A forms-heavy app cares more about TTI than FPS. The thresholds are configurable via
.lanternarc, but the defaults won’t be perfect for everyone.
The goal was never to build a universal profiler. It was to build the right tool for the most common case: a React Native team that wants to know how their app performs across both platforms without switching between two entirely different toolchains.
What’s next — AI that actually understands your app
Two features in the pipeline that I’m particularly excited about.
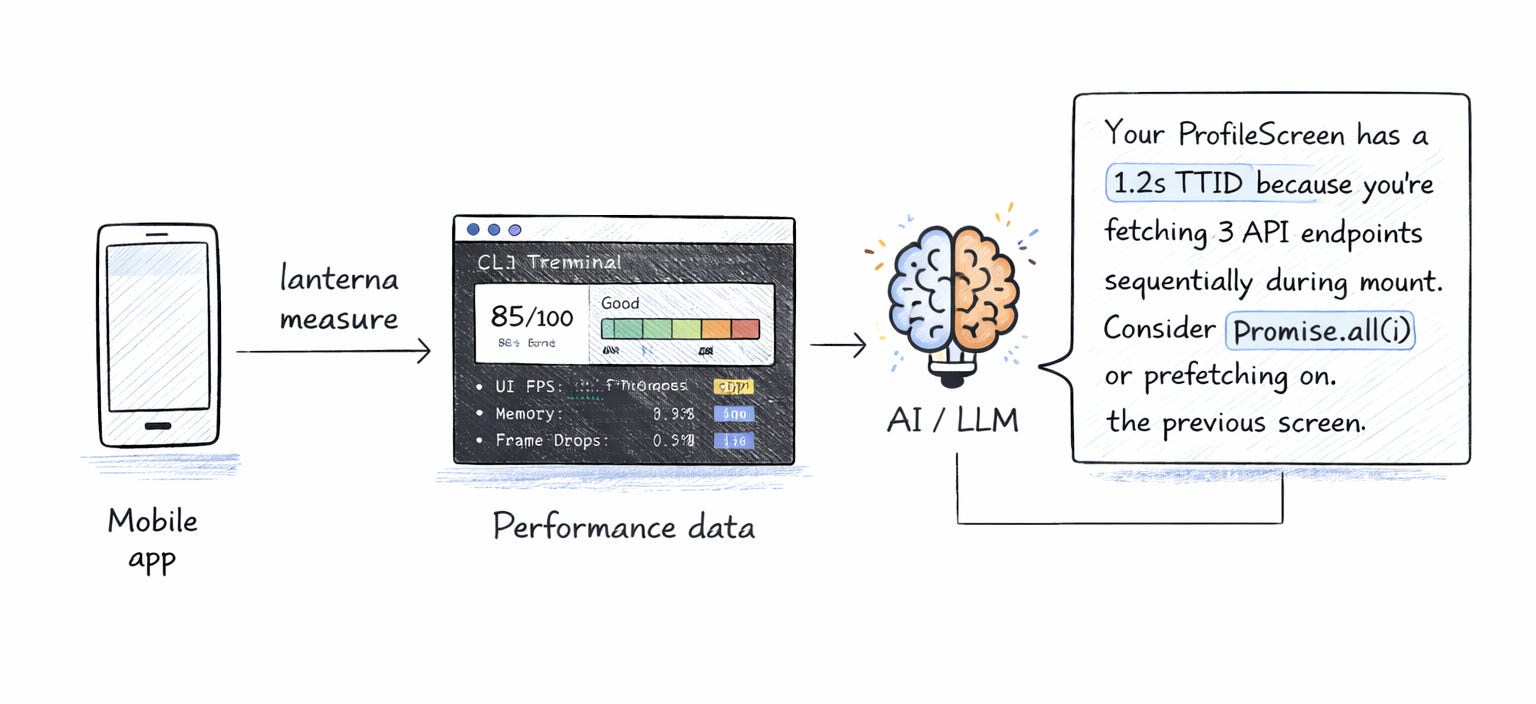
AI-Powered Analysis. Run lanterna measure --analyze and your measurement data goes to an LLM that generates app-specific recommendations. Not generic “use React.memo” advice — actual contextual analysis:
“Your ProfileScreen has a 1.2s TTID because you’re fetching 3 API endpoints sequentially during mount. Consider Promise.all() or prefetching on the previous screen.”
The AI sees your real data: which screens are slow, what the memory curve looks like, and where bridge calls spike. It gives you a diagnosis, not a textbook.
MCP Server. Lanterna exposes itself as an MCP tool so AI coding assistants — Claude Code, Cursor, Copilot — can run measurements and read reports as part of their workflow. Ask your AI to “fix the performance issues on the profile screen” and it actually has the data to do it. Plus, a .lanterna context file that any AI coding tool picks up automatically.
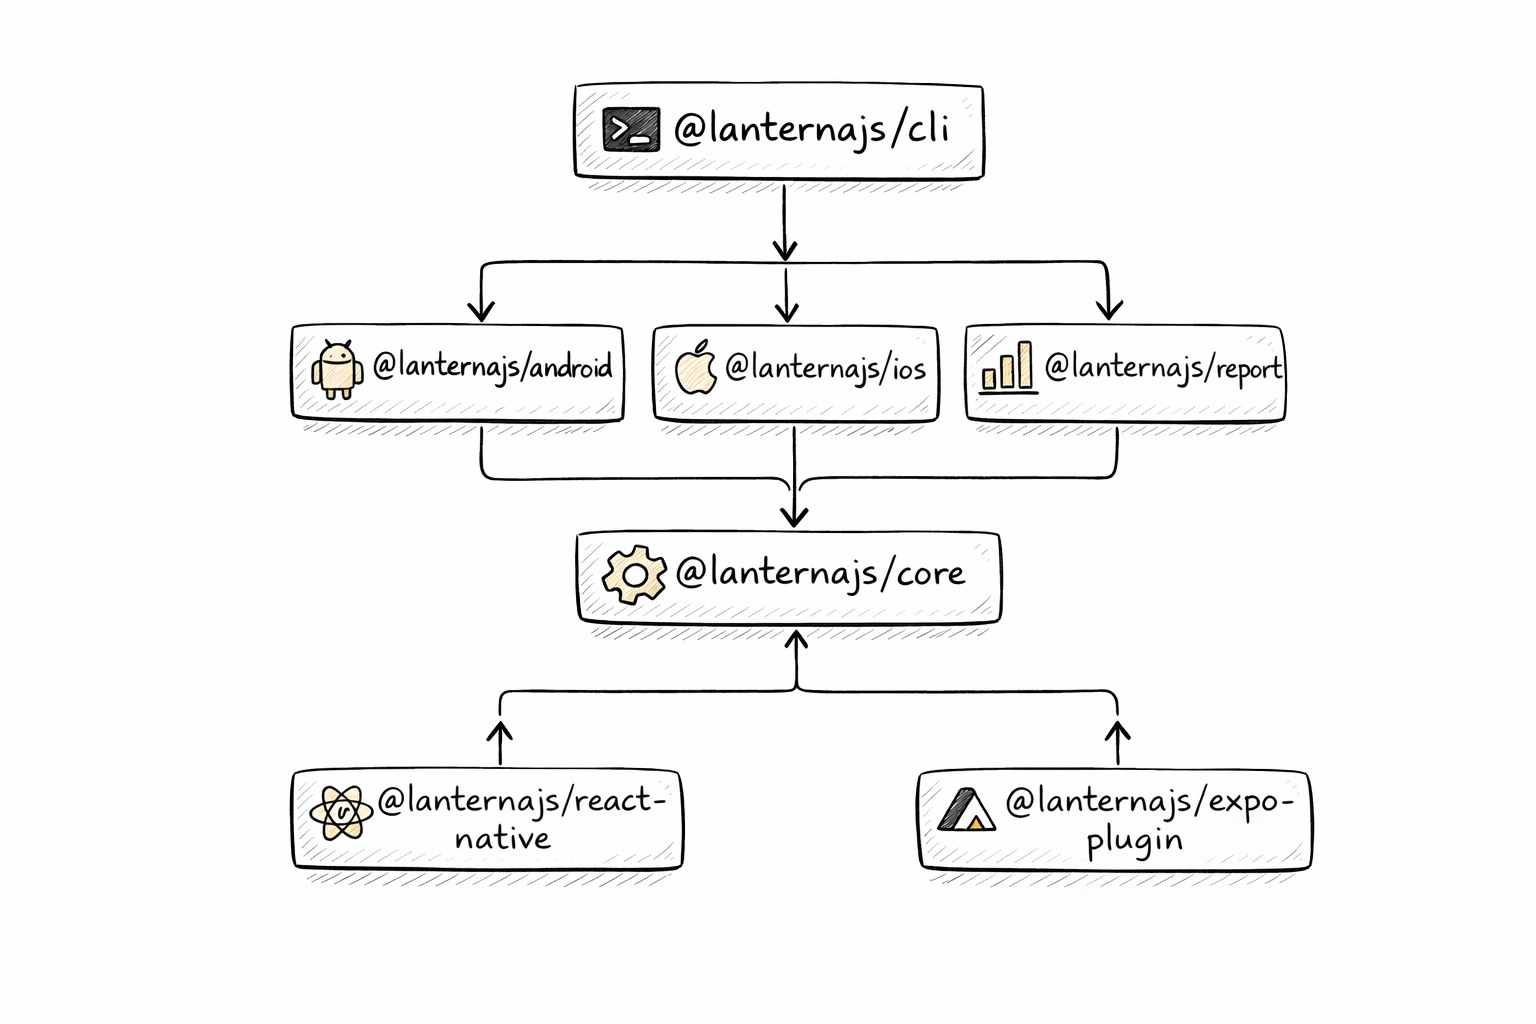
What’s inside
Lanterna is a monorepo with seven packages. Each one does one thing.
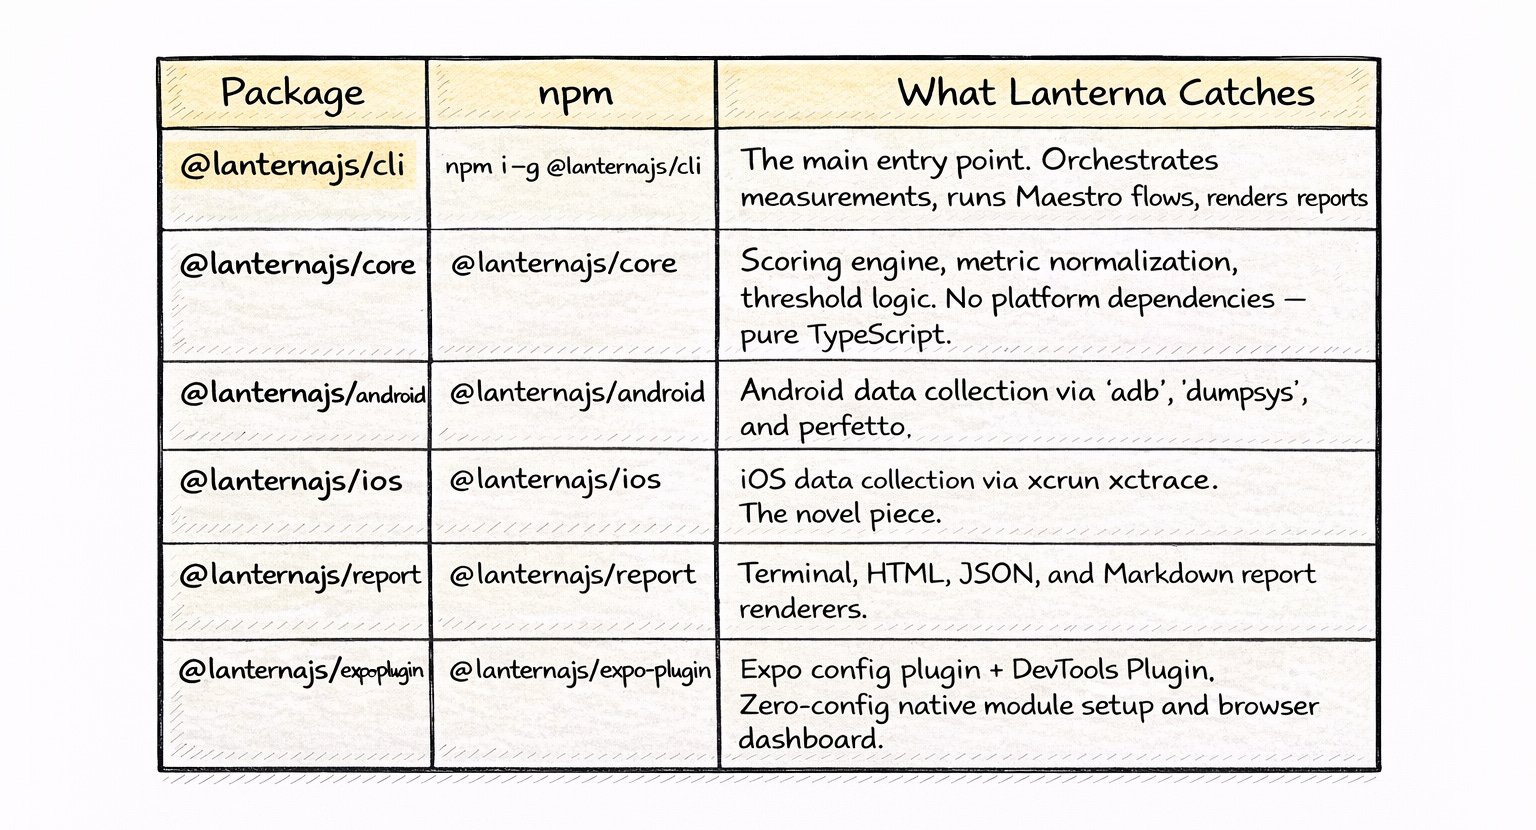
The separation is intentional. You can use @lanternajs/core standalone to build your own scoring pipeline. You can use the iOS or Android packages independently if you only ship on one platform. And the CLI ties everything together for the common case.
Try it
Lanterna is open source. The CLI, the scoring engine, the native modules, the Expo plugin — all of it.
npm install -g @lanternajs/cli
lanterna measure com.your.app
Star the repo, file issues, tell me what metrics matter to your team. This is v1. The roadmap is long, and community input shapes what comes next.
Performance doesn’t have to be a dark art. It can be a number. Let’s make it one.